Buy low, sell high
“Past performance is not a reliable indicator of future results.” As fiduciary advisors, this statement is burned into our psyche at Bryant & Brannock. We were reminded of this recently when our conversation with a client turned to his account performance since the latest rebalancing of his portfolio. The positions we reduced outperformed the positions we added to. In other words, he would have been better off if we had done nothing. Ouch! Why skim from the winners and beef up the losers? It is a great question and one that is especially timely. The Dow Jones Industrial Average index, the S&P 500 Index and the NASDAQ index all hit record highs last week.
Most of us are familiar with the old adage to buy low and sell high. It makes sense whether you are talking about stocks, baseball trading cards or Beanie Babies. If we sell something for more than we paid for it, we make a profit. That is a simple concept. It becomes more complicated when you take into consideration variables such as time horizon, present value and future value. For example, the discounted meat at the grocery store has a limited shelf life, and clothing that is marked 50% off is probably no longer in fashion or is out of season. Conversely, we expect to pay more for fresh meat and the trendiest fashions coming right off the runway. We inherently understand the influence of time horizon on these types of products.
What happens if we change up the variables a little bit? Maybe you have a big freezer so you can stock up on discounted meat. You take on the risk of potential freezer burn or perhaps a power outage, but you are willing to assume that risk to save money now. And maybe you don’t care about being fashionable, or you can wear shorts in January because you don’t spend much time outside. Your ability to control these variables allows you to apply a different present value and future value to these items than other people might.
Determining the present value and future value of stocks is much more complicated. There are many, many variables to consider, and we have virtually no control over any of them. We can mitigate some of that risk by investing in baskets of stocks, like an index, rather than buying individual stocks. We can further reduce risk by investing in a variety of sectors. Certain market conditions will benefit some asset classes more so than others. This philosophy of diversification is the foundation of our approach to investing.
Which brings us back to that basic investing principle of buying low and selling high. With investments across a broad range of asset classes, some sectors are going to outperform others at different times. We can’t know for certain which sectors will be in the best position for growth over the upcoming time frame. By periodically rebalancing, we force ourselves to sell positions that have done well, and to buy positions that have underperformed. We are selling high, and, hopefully, buying low. We believe that this system, done with the appropriate asset allocation, provides a practical approach for long term investing.
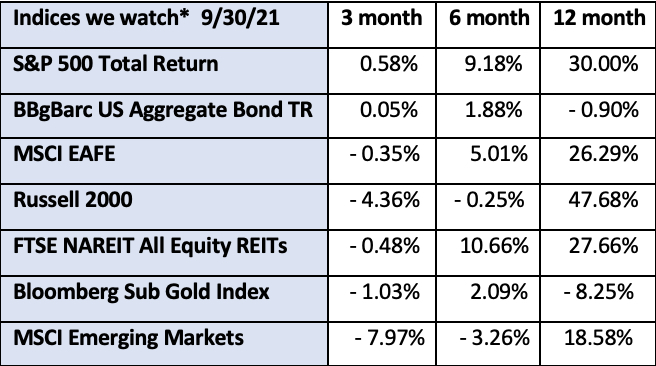
*The index returns are drawn from Morningstar Advisor Workstation. Indexes are unmanaged and cannot be invested in directly by investors. MSCI EAFE NR USD-This Europe, Australasia, and Far East index is a market-capitalization-weighted index of 21 non-U.S., industrialized country indexes. S&P 500 TR USD – A market capitalization-weighted index composed of the 500 most widely held stocks whose assets and/or revenues are based in the US; it’s often used as a proxy for the stock market. TR (Total Return) indexes include daily reinvestment of dividends. Bloomberg US Agg Bond TR USD This index is composed of the BarCap Government/Credit Index, the Mortgage Backed Securities Index, and the Asset-Backed Securities Index. The returns we publish for the index are total returns, which includes the daily reinvestment of dividends. The constituents displayed for this index are from the following proxy: iShares Core US Aggregate Bond ETF. MSCI Emerging Markets IndexSM is a free float-adjusted market capitalization index that is designed to measure equity market performance in the global emerging markets. Russell 2000 – Consists of the smallest 2000 companies in the Russell 3000 Index, representing approximately 7% of the Russell 3000 total market capitalization. The returns we publish for the index are total returns, which include reinvestment of dividends. The MSCI Emerging Markets (EM) IndexSM is a free float-adjusted market capitalization index that is designed to measure equity market performance in the global emerging markets. As of May 2005 the MSCI Emerging Markets Index consisted of the following 26 emerging market country indices: Argentina, Brazil, Chile, China, Colombia, Czech Republic, Egypt, Hungary, India, Indonesia, Israel, Jordan, Korea, Malaysia, Mexico, Morocco, Pakistan, Peru, Philippines, Poland, Russia, South Africa, Taiwan, Thailand, Turkey and Venezuela.. The FTSE NAREIT Equity REITs Index is an index of publicly traded REITs that own commercial property. All tax-qualifies REITs with common shares traded on the NYSE, AMSE or NASDAQ National Market List will be eligible. Additionally, each company must be valued at more than $100MM USD at the date of the annual review. Equity REITs include Diversified, Health Care, Self Storage, Industrial/Office, Residential, Retail, Lodging/Resorts and Specialty. They do not include Hybrid REITs, Mortgage Home Financing or Mortgage Commercial Financing REITs. Bloomberg Sub Gold TR USD Description unavailable. Formerly known as Dow Jones-UBS Gold Subindex (DJUBSGC), the index is a commodity group sub-index of the Bloomberg CI composed of futures contracts on Gold. It reflects the return of underlying commodity futures price movements only and is quoted in USD.